From the chart we know the average temperature of is the same as that of . A. July, August B. June, July C. February, March D. June, September 查看更多


题目列表(包括答案和解析)

In our solar system (太阳系), Earth and the other eight planets travel around the sun.. Unlike  Earth, Saturn (土星) has tings. The chart shows more ways in which Saturn and Earth are different.

Category(类别)

Earth

Saturn

Average distance(平均距离)from the SUII

93 million miles

890 million miles

Length (长度)of day

24 hours

10 hours 39 minutes

Length of year

365 days

about 10,585 days

Number of moons(卫星)

l

33

What it's made of

rock and water

gas (气体)(hydrogen and

helium)

1. From the chart we can know that Saturn is____________from the sun than Earth.

2. Saturn has____________than Earth.

3. A day on Saturn is shorter than a day____________

4. Earth is made of____________

5. There are____________ planets in our solar system besides(除了……还) Earth and Saturn.

查看答案和解析>>

根据上面的电视节目表,回答下列问题。

1.All the TV programs last ________ a day.

2.The program which lasts the longest is ________.

3.How many programs last only half an hour?

4.From the chart, we know what ________; when ________; which ________.

查看答案和解析>>

阅读理解。

                                      Do You Love Watching Tom and Jerry?
     The cartoon series, Tom and Jerry, is a very popular program. What do you think of it? Come on and
try our questions.
NAME      Paul Smith
AGE        12
SCHOOL  primary school
1. Who is Paul Smith?
A. The chart (表格) designer.
B. One of the characters.
C. A primary school student.
D. A primary school teacher.
2. What does the comment of the first question mean?
A. Paul isn't satisfied with the stories.
B. Paul doesn't like the pictures.
C. Paul is very satisfied with the stories.
D. Paul likes the music very much.
3. We can guess from the chart that Paul may be interested in ______.
A. painting
B. dancing
C. sports
D. writing
4. From the chart, we know that ______.
A. Paul is more satisfied with the show time than the music
B. Paul can draw cartoons very well
C. Paul has no problems with the show time
D. Paul enjoys watching the cartoon series very much
5. Why did the writer design this chart?
A. To see what kinds of movies people like.
B. To see how people like Tom and Jerry.
C. To make sure who likes the cartoon series.
D. To make sure whether the show time is suitable.

查看答案和解析>>

阅读理解。
     Think about your hometown. Does it get a lot of rain in summer? How much rain is normal? Rainfall can
vary from year to year. Therefore, it is important to find the average (平均值) The following chart shows the
average rainfall in a city for each month over ten years.

     From the chart, we can see that spring is the driest season. During March, April and May, the average
total rainfall for the whole season is 35 mm. Summer is the wettest season of the year. July has the most
rainfall during this season. In both autumn and winter, there is moderate rainfall, with autumn having a little
more rain than winter.
1. This chart shows _______ each month.
A. the amount of rain
B. the rain farmers need
C. the wettest season of the year
D. the water people used
2. Which season is "the rainy season"?
A. Spring.
B. Summer.
C. Autumn.
D. Winter.
3. What does the underlined word "vary" mean?
A. show
B. increase
C. drop
D. change

查看答案和解析>>

We surveyed 300 young people on what they like to do at weekends. One hundred people are from the age of 11–18, one hundred 19–26 and one hundred 27–35. The following chart shows their answers:

Favourite things to do (by ages)

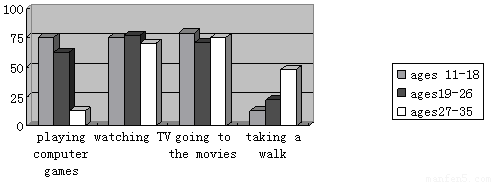
1.According to the survey, which two activities do most people enjoy doing?

A.Playing computer games and watching TV

B.Playing computer games and taking a walk

C.Watching TV and going to movies

D.Going to movies and taking a walk

2. From the chart above, we can see the younger people are, the less they like ________.

A.taking a walk                           B.watching TV

C.going to the movies                      D.playing computer games

3.Which of the following is TRUE according to the chart?

A.All the people like taking a walk most.

B.The people of 11–18 like taking a walk least.

C.The most people like going to the movies in the 19–26 group.

D.The people of 27–35 like playing computer games most.


查看答案和解析>>


同步练习册答案